Digging Deeper into Gathering and Studying Data
Prior to truly digging into data, start any meeting by engaging participants in an activating activity. One quick idea is having people find a person they have not connected with today and share one Good Thing that they feel is working well in their classroom or grade level or building. Another quick opening question might be "Why are you in education?" In addition, on the Getting Started page,we include a video in which Simon Sinek explains the importance of starting with why; if this has not been established, take a few minutes to view the video and get participants on the same page with the reason(s) behind the task they are about to complete.
Next, narrow the focus on who will be gathering and studying which data. For example, if the focus is on achievement data, you may divide into content area groups. Once your groups have been established, use the Data Dialogue Protocol and complete your data analysis procedure.
Next, narrow the focus on who will be gathering and studying which data. For example, if the focus is on achievement data, you may divide into content area groups. Once your groups have been established, use the Data Dialogue Protocol and complete your data analysis procedure.
Observations recorded fall under Stage 2: Explore and must be non-judgmental and descriptive, absent of causality and predictions. We must gather multiple data and drill down before drawing conclusions. A sample of the data gathered will appear with observation at each stage. The examples below are not comprehensive but are intended to show an example that can be duplicated. Remember anything in orange is a hyperlink (For example: you can download the Top to Bottom Ranking MS Excel file below).
|
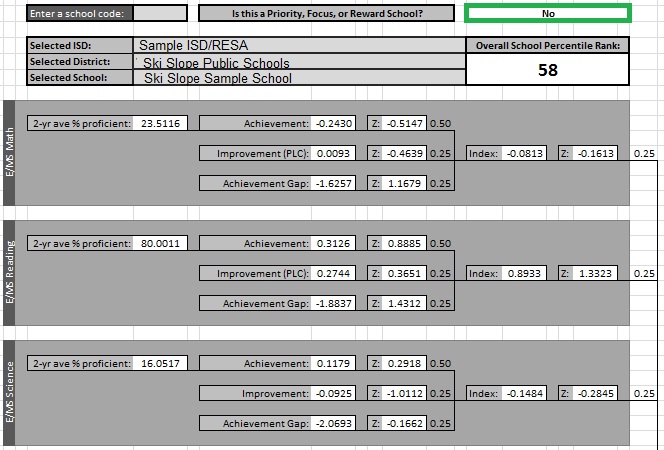
Top to Bottom RankingThough the 2-year average for percent proficient does not drive the Z-scores or ranking at all, it does give a reasonable estimate of where a building is scoring and how much they need to increase. In the example shown, Math shows 23.5% proficient needing to increase by 61.5% in 10 years (2022) OR 6.15% per year. The school's achievement is slightly below the state average with Z = -0.5147, and the building average for improvement is also slightly below state average, with Z = -0.4639.
|
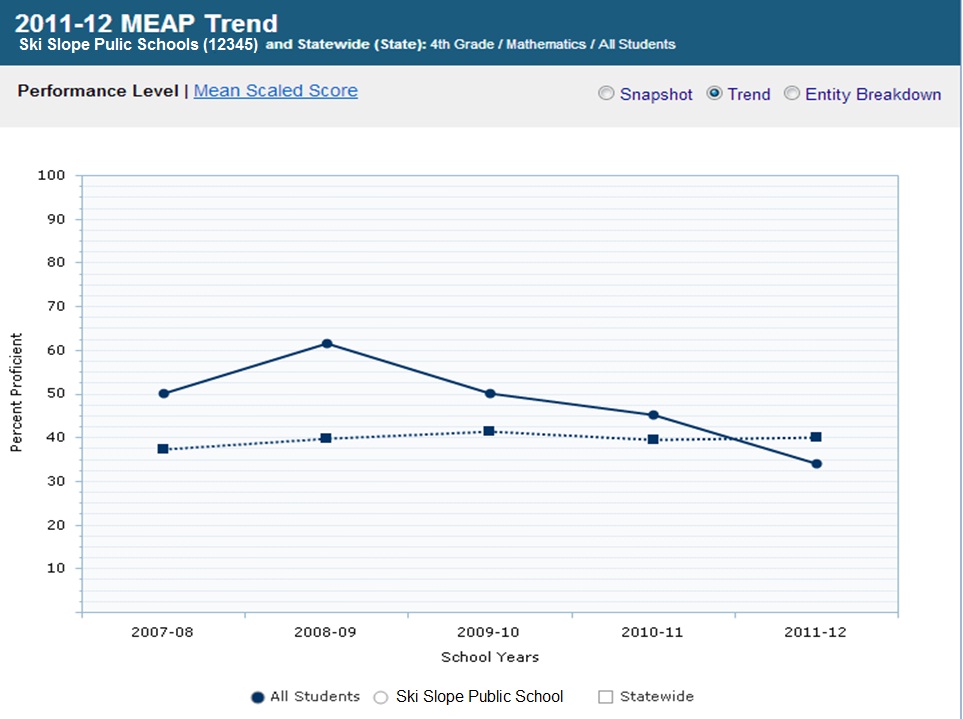
MI School Data (.org)Looking at MEAP Trend data over the past five years for 4th grade mathematics, we observe a steady decrease over the past four years in percent proficient, from 61.5% to 34% (27.5% in 4 years or 6.9% per year). In 2011-2012, 4th graders were 6% below the state average in proficiency. In order to meet the 85% proficiency target in 10 years, math proficiency needs to increase 5.1% per year. Similar statements regarding proficiency targets should be recorded at each grade level. In addition, simply Download/Print the table of data found (sample MS Excel below).
|
|
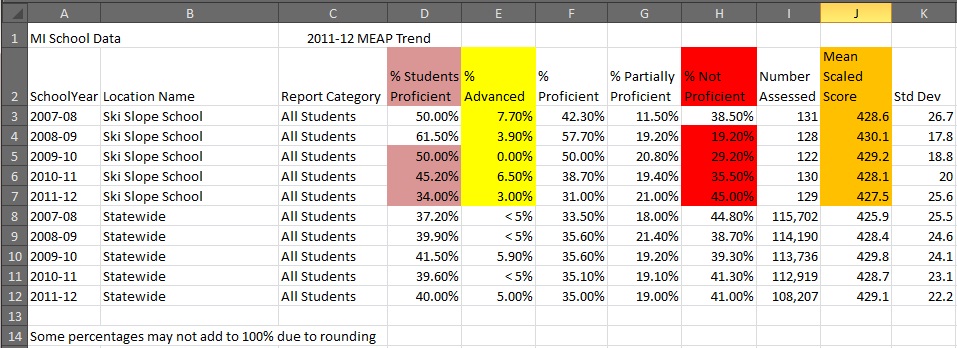
Verification of the four-year decline of student proficiency from 61.5% to 34.0% can be seen in column D. Based on the new Accountability Metrics, percent proficient does not drive rankings or designations. Therefore, when looking at multiple points for this data set, examine the top category, bottom category, and average category. View a brief video to understand why (coming soon). For example: Percent of Advanced students has fluctuated from 0 - 7.7%, most recently 3% advanced. Percent of Not Proficient has drastically increased the past four years from 19.2% to 45%. In general, schools should decrease % Not Proficient and increase % Advanced. The average measure of ALL students driving 75% of the top to bottom ranking has decreased over the past 4 years from a scale score of 430.1 (or 1.7 points above the state) to 427.5 (or 1.6 points below the state).
MI School Data also allows for Item Analysis at the Strand and GLCE level when users log in.
MI School Data also allows for Item Analysis at the Strand and GLCE level when users log in.
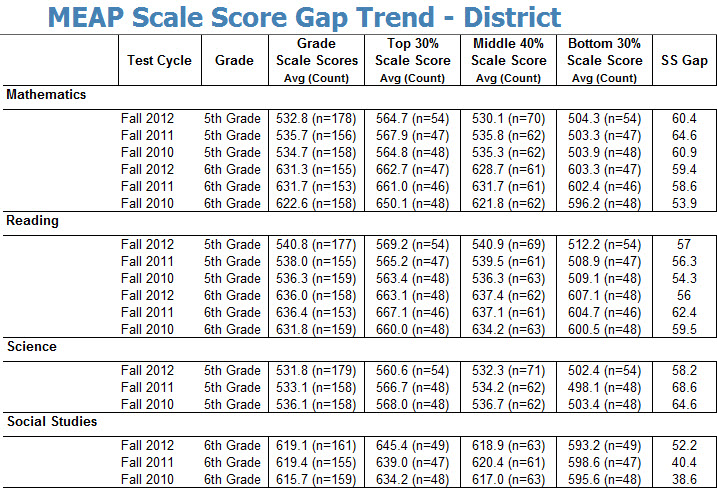
IRIS/IGOR Log In (select ISD/RESAs)Many districts are interested in seeing the trend of the Bottom 30%. This can be accomplished by using the raw data file or IRIS has a report called the MEAP or MME Scale Score Gap Trend - District. This will allow schools to look at the trend data for all students, the Bottom 30%, and the Top 30%.
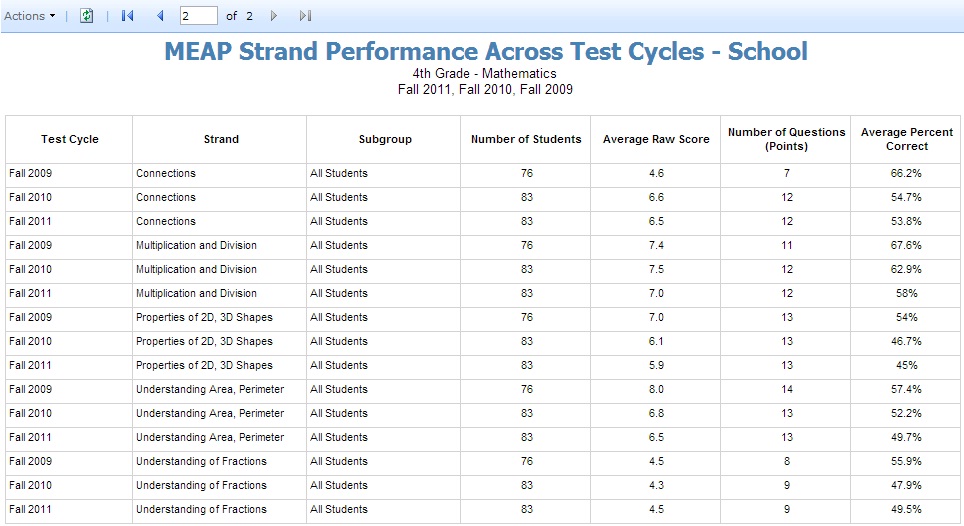
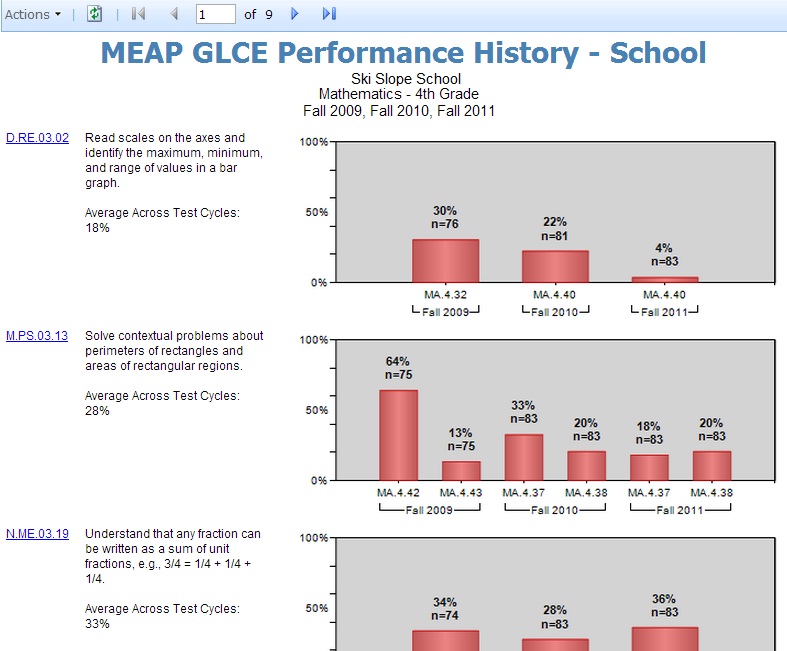
Drill down beyond the global level of proficiency ratings and average scale score whenever possible to GLCEs/HSCEs/or Common Core State Standards. The sample reports on the right show MEAP Strand performance across three years. Area/Perimeter seems to be the most tested strand with a decline; however, you will see this example shows every strand declining. The second report shows GLCE performance over the past three years on the MEAP for 4th grade math. These first pages show where most students are not competent at the appropriate rigor as measured by the state assessment. Over the past three years, 82% of students failed to correctly answer one question on D.RE.03.02 and the percent correct has declined steadily from 30% to 4%. More bars in the report indicate more items on the test that measure the indicated content expectation. NOTE: Not all GLCEs align with the CCSS and you should reference the cross walks provided by MDE. |
|
In order to close achievement gaps, a school should identify the GLCEs that 75% or more of students generally score correctly (the last two pages of this report). i.e. Over the past 3 years, 86% of students correctly answer two questions per year on N.MR.03.09 ,and the percent correct ranges from 81% to 93% without a noticeable trend. Then include these items on a pre- or post- test to identify the students (usually the bottom 20%) who need intervention on standards on which students usually score well.
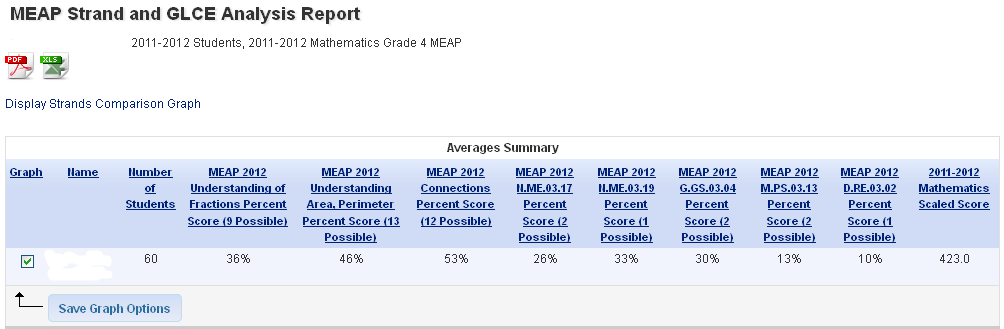
Data Director Log In (select ISD/RESAs)Several MEAP Strand and GLCE Analysis Reports are available in Data Director for a single year of data at one time. Historical data is also available to look back on other years. The graph on the right provides Strand summary information and the table below breaks down GLCE percent correct.
|

|
Since the MEAP has removed items that no longer align with a specific grade level in the Common Core for ELA and Math, please reference the MDE guidance on GLCE and CCSS alignment or, for math only, OAISD What Moved in Math.